31 Aug 2026
Financial Rate Comparisons Across Savings Vehicles and Fixed Income Options
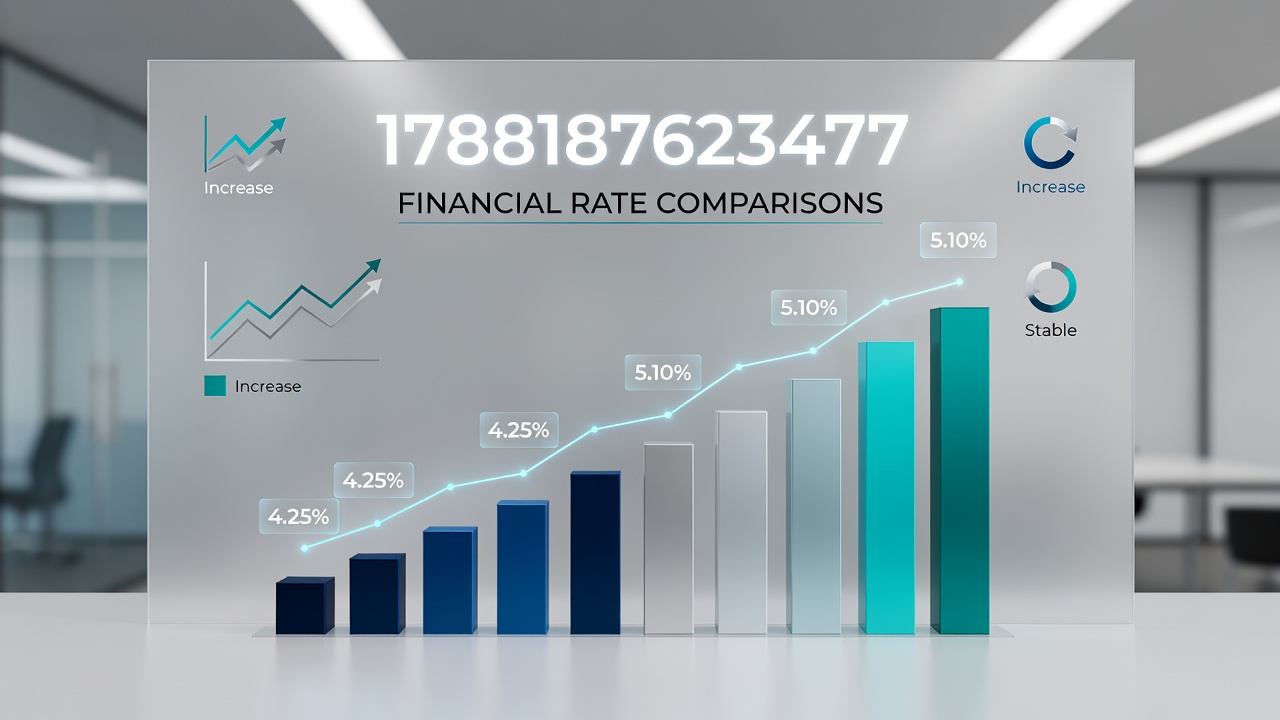
Financial rate comparisons help individuals evaluate returns on different deposit accounts and fixed income instruments, and data released in August 2026 highlighted shifts in yields across major economies as central banks adjusted policies. Observers note that these patterns emerge when market participants review benchmarks from institutions such as the Federal Reserve and the European Central Bank, allowing side-by-side analysis of short-term versus longer-term options.
Deposit Account Yields in Perspective
High-yield savings accounts often post rates that fluctuate with overnight lending benchmarks, while certificates of deposit lock in returns for set periods ranging from three months to five years. Researchers at the Bank of Canada documented average rates on one-year CDs reaching 4.85 percent in mid-2026, whereas money market funds tied to short-term government securities hovered near 4.60 percent during the same window. Those who track these figures through integrated platforms see how minimum balance requirements and withdrawal limits influence net returns after fees, and comparisons become clearer when users sort options by effective annual percentage yield.
Regional Variations Shape Choices
European markets showed distinct patterns in August 2026 after the European Central Bank held its deposit facility rate steady at 3.75 percent, prompting banks in Germany and France to adjust savings products accordingly. Australian savers meanwhile faced different conditions as the Reserve Bank of Australia maintained its cash rate at 4.10 percent, leading to competitive term deposit offers that sometimes exceeded North American equivalents. Data indicates that currency considerations add another layer for those holding accounts across borders, since exchange rate movements can offset or enhance quoted yields when converted back to a home currency.
Fixed Income Instruments and Benchmark Comparisons
Treasury securities issued by governments provide another category for rate evaluation, with two-year notes and ten-year bonds reflecting expectations around inflation and policy paths. In the United States, August 2026 auctions revealed two-year yields settling near 4.25 percent while ten-year notes traded around 4.40 percent, creating a relatively flat curve that differed from steeper profiles observed earlier in the decade. Corporate bond yields, by contrast, incorporated credit spreads that widened or narrowed depending on issuer ratings, and analysts at academic institutions such as the University of Toronto have tracked how these spreads averaged 1.15 percent over comparable government benchmarks during the same period.
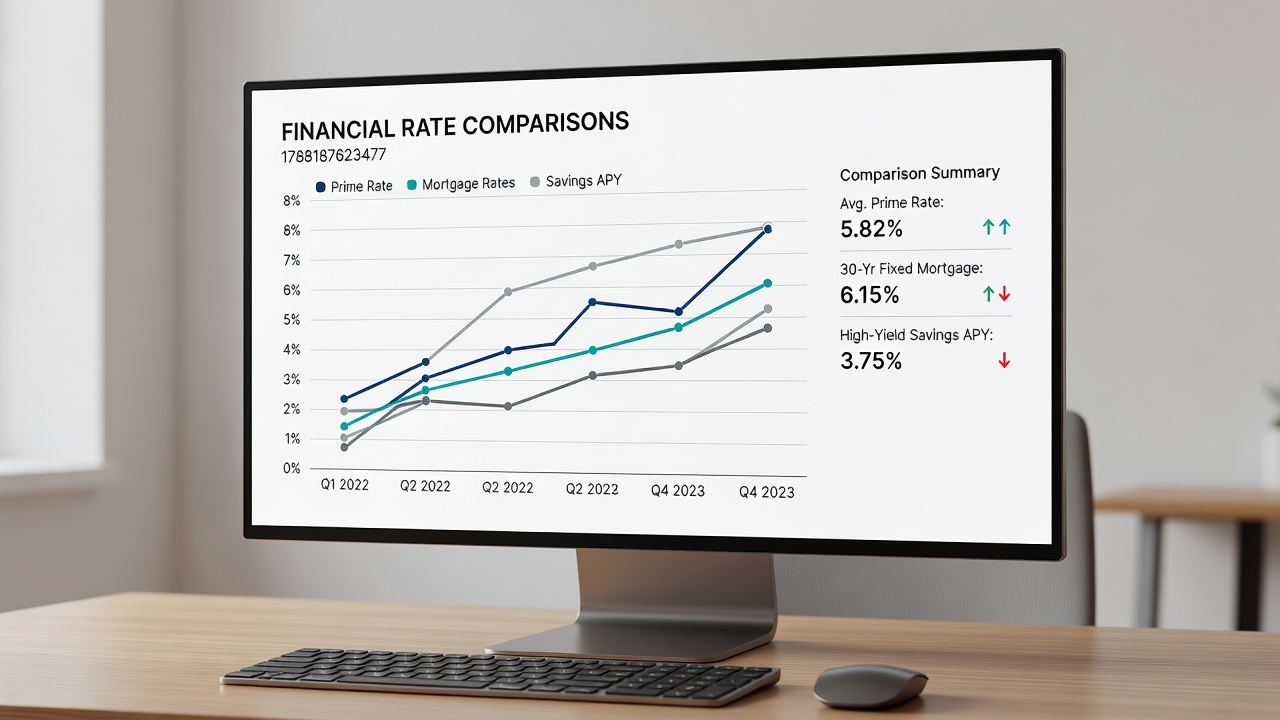
People who compare these instruments often examine duration metrics alongside yield figures, since longer maturities expose holders to greater price volatility when rates move. Municipal bonds add a tax-advantaged dimension in certain jurisdictions, with after-tax equivalent yields sometimes surpassing taxable alternatives for higher-income brackets even when nominal rates appear lower.
Tools and Data Sources for Ongoing Evaluation
Integrated financial platforms now aggregate rate feeds from multiple providers, enabling users to filter by term length, liquidity features, and geographic availability in a single interface. Figures released by the Bank for International Settlements in its quarterly reviews show that average spreads between the highest and lowest quoted rates for similar products narrowed to 0.75 percentage points in 2026, suggesting increased competition among deposit-taking institutions. Those who review weekly updates from sources like the Federal Reserve Economic Data or the European Central Bank statistical warehouse can identify when new products enter the market and adjust allocations accordingly.
Timing Considerations Around Policy Releases
Economic calendars in August 2026 included several inflation readings and employment reports that moved short-term rate expectations, and market participants who monitored these events observed immediate repricing in both deposit and bond markets. Comparisons conducted immediately before and after such announcements reveal how forward guidance influences offered yields, particularly for products that reset periodically rather than locking in rates for the full term.
Conclusion
Financial rate comparisons continue to evolve as new data emerges each month, and comprehensive evaluation requires attention to both headline yields and the structural features that determine realized returns over time. Observers who maintain systematic records across multiple product types and regions position themselves to act when opportunities align with their liquidity needs and time horizons.