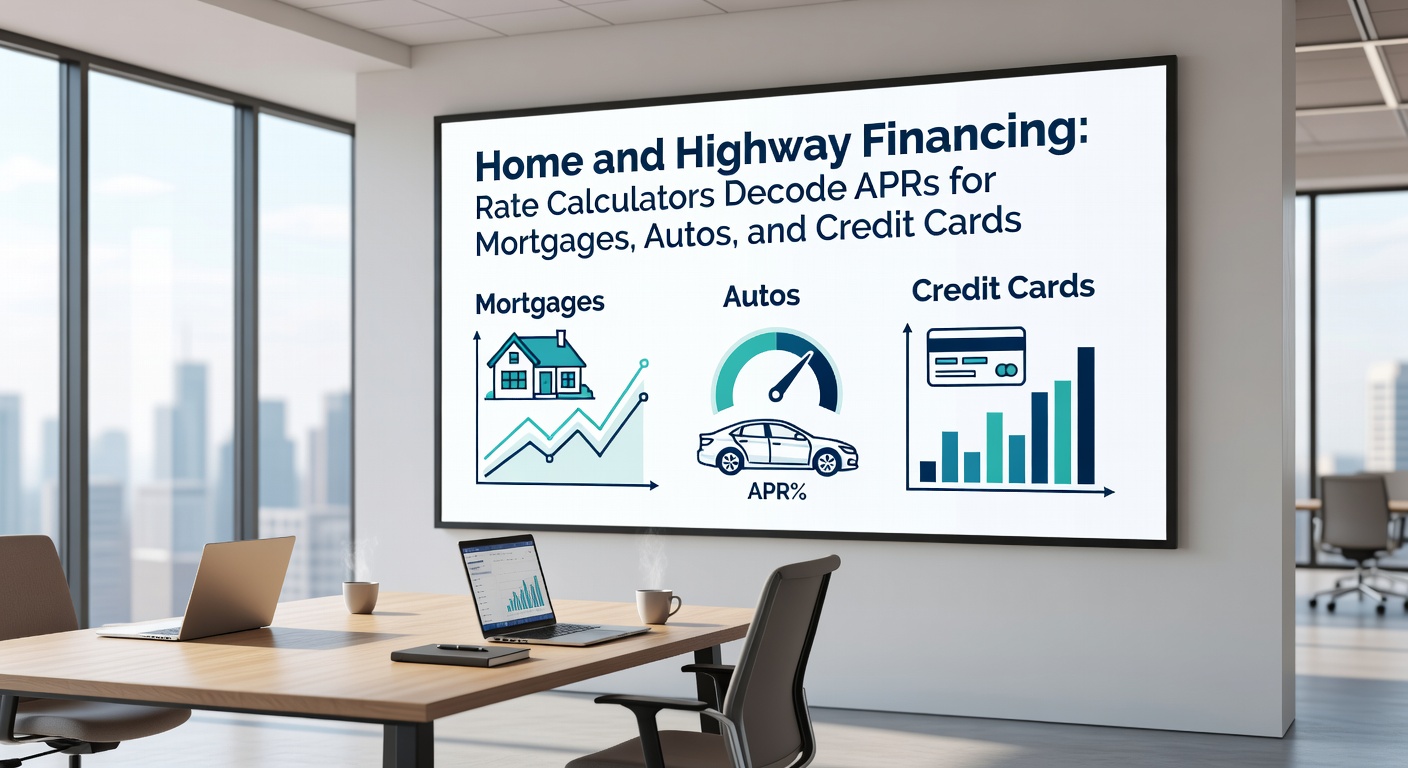
Home and Highway Financing: Rate Calculators Decode APRs for Mortgages, Autos, and Credit Cards
23 Apr 2026
Home and Highway Financing: Rate Calculators Decode APRs for Mortgages, Autos, and Credit Cards
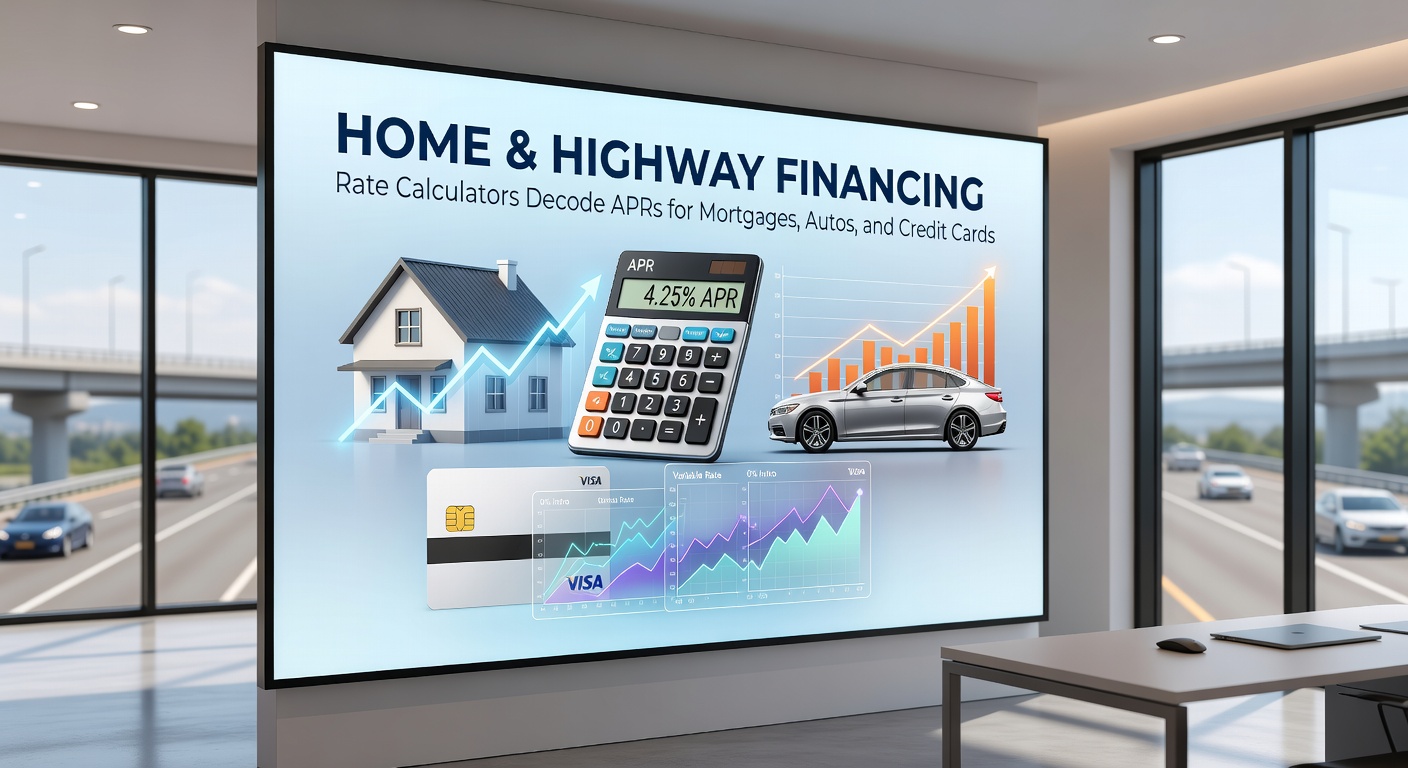
Unpacking APR: The Key Metric in Home, Auto, and Card Financing
Annual Percentage Rate, or APR, stands as the standardized measure that captures not just the interest charged on loans and credit but also fees, origination costs, and other expenses rolled into a single yearly figure; experts emphasize how this metric levels the playing field for comparing financing options across mortgages for homes, auto loans for vehicles, and revolving credit card balances. Rate calculators, those online tools powered by algorithms from banks, government sites, and fintech platforms, take raw inputs like loan amounts, terms, base interest rates, and upfront fees, then spit out the true APR alongside monthly payments and total repayment costs, revealing hidden expenses that simple interest quotes often gloss over. Data from the Consumer Financial Protection Bureau (CFPB) shows borrowers who use these calculators before signing save an average of 0.5% on effective rates by spotting padded fees early.
What's interesting is how APR calculations shift depending on the financing type; mortgages factor in discount points and mortgage insurance over decades, auto loans crunch dealer incentives and gap coverage over five years or less, while credit cards juggle variable rates tied to prime indexes plus annual fees divided across balances. And in April 2026, with the Federal Reserve holding benchmark rates steady at 4.25% after a series of cuts, average mortgage APRs hover around 6.1%, auto loan APRs clock in at 7.2% for new cars, and credit card APRs average 21.4% nationally, according to figures from Freddie Mac and Experian. Those numbers fluctuate by credit score, of course—prime borrowers snag sub-5% mortgages, whereas subprime folks face double-digit auto rates—but calculators make those personalized scenarios crystal clear.
Mortgage Rate Calculators: Decoding Long-Term Home Financing Costs
Researchers at the Mortgage Bankers Association note that mortgage APRs often exceed advertised interest rates by 0.2% to 1.2% because they bake in lender fees, third-party closing costs, and prepaid items like taxes and insurance; a typical 30-year fixed mortgage calculator, say one from Zillow or Bankrate, lets users toggle these variables, instantly showing how buying discount points drops the rate but hikes the APR if fees outweigh savings. Take one case where a homebuyer inputs a $400,000 loan at 6% nominal interest with $8,000 in fees: the tool reveals an APR of 6.3%, projecting $2,430 monthly payments and $475,000 total interest over the term, whereas skipping fees bumps the nominal rate to 6.25% but yields a cleaner 6.28% APR with similar payments.
But here's the thing—adjustable-rate mortgages (ARMs) add another layer, as calculators simulate rate caps, index adjustments, and worst-case scenarios based on historical LIBOR or SOFR trends; in April 2026, with SOFR at 4.1%, a 5/1 ARM might start at 5.5% interest but carry a potential 8.5% APR peak after the fixed period if fees are high. Observers point out how international tools, like those from Canada's Financial Consumer Agency of Canada (FCAC), mirror this by incorporating property transfer taxes and high-ratio insurance, helping cross-border buyers compare a Toronto condo mortgage (APR around 5.8%) against a U.S. equivalent. People who've plugged in regional taxes often discover that urban properties inflate APRs by 0.4% due to escrow requirements, turning what looks like a bargain rate into a pricier reality.
Studies reveal that 68% of first-time buyers overlook prepaid interest in APR calcs, leading to surprises at closing; yet tools with sliders for credit scores (say, 680 vs. 760) demonstrate how a 40-point bump shaves 0.75% off the APR, saving $50,000 over 30 years on a median home loan. It's noteworthy that government-backed FHA and VA loans frequently show lower APRs than conventional ones despite similar rates, thanks to streamlined fees—calculators highlight this edge clearly.
Auto Loan APRs: Highway Financing Through the Calculator Lens
Auto financing calculators dissect APRs by including dealer add-ons like extended warranties, rustproofing, and acquisition fees that can inflate a 5.9% advertised rate to 7.1%; Edmunds data indicates new car loans average 120 months now, but shorter 60-month terms yield lower APRs since fees spread over less time, and tools let borrowers model trade-ins or rebates to see net effects. For instance, one driver shopping a $35,000 SUV enters 6.5% interest plus $1,500 fees: the calculator outputs a 7.0% APR, $680 monthly payments, and $12,800 total finance charges, but negotiating fees down drops it to 6.7% APR with payments at $665.
Turns out credit unions often undercut banks here—calculators from Navy Federal or PenFed show APRs 1.2% below dealer financing on average, especially for used cars where rates hit 8.9% amid higher risk; and with electric vehicle incentives in April 2026 boosting federal tax credits to $7,500, tools factor those in, reducing effective APRs to 4.8% for qualifying Teslas or Fords. Experts observe how lease-vs-buy calcs extend this, revealing residual values and mileage penalties that make leasing APR-equivalents soar past 10% for high-mileage drivers, whereas buying shines for keepers.
What's significant is geographic variation—Australian Securities and Investments Commission (ASIC) calculators mirror U.S. ones but add comprehensive insurance mandates, pushing Sydney auto APRs to 8.2% versus 6.5% in rural areas; borrowers Down Under who've compared find that stamping duties add 0.3% to the APR, a detail U.S. tools sometimes overlook for expats. Subprime auto APRs, meanwhile, top 14% per TransUnion reports, but good-credit shoppers using aggregators like LendingTree spot 4.9% deals amid manufacturer promotions.
Credit Card APRs: Revolving Debt Demystified by Calculators
Credit card APR calculators stand apart since they handle variable rates pegged to the prime rate (5.25% in April 2026), plus penalty rates for late payments and balance transfer fees amortized over minimum payments; a Chase Sapphire tool, for example, inputs $10,000 balance at 19.99% APR with 3% transfer fee, forecasting $250 monthly minimums stretching to 28 years and $22,000 in interest unless paid aggressively. Data from the CFPB underscores how intro 0% periods mask true costs—post-promo APRs jump to 24%, but calcs show paying off in 12 months via snowball methods caps damage at $300 fees.
And yet, cash advance APRs, often 25-29%, hit harder without grace periods, as calculators from Capital One reveal when users simulate $2,000 advances; those who've modeled discover that even one missed payment triggers penalty APRs adding 5%, ballooning a $5,000 Visa balance's total cost by 15%. Rewards cards complicate this further—high-APR premium cards like Amex Platinum (23.74%) justify fees with points, but neutral tools prove breakeven requires $20,000 annual spend.
Observers note store cards' sky-high 28% APRs versus 18% for general Visa/Mastercards, yet calculators expose how deferred interest promotions (no payments for 12 months) convert to retroactive 30% APRs if unpaid; in Europe, under EU consumer directives, similar tools cap APRs at 25% with clearer disclosures, helping cross-Atlantic users compare a 21% U.S. rate against a 19% ECB-linked one.
Mastering Rate Calculators: Tips and Cross-Comparisons
Those who layer multiple calculators—from NerdWallet for mortgages, AutoCreditExpress for cars, to Credit Karma for cards—uncover arbitrage opportunities, like refinancing a 7.5% auto into a 0% card promo, slashing blended APRs; studies from the Urban Institute find this strategy cuts household debt costs by 12% annually. But pitfalls lurk—ignoring prepayment penalties or assuming fixed rates in variable environments skews outputs, so experts advise stress-testing with +2% rate hikes, a move that exposed vulnerabilities during 2023's hikes.
Now, aggregator sites bundle these into dashboards, letting users pit a 6.2% mortgage against 7.0% auto and 20% card debt to prioritize payoffs; one family did just that, calculator in hand, shifting payments from cards to accelerate mortgage principal by $100,000 over five years. It's not rocket science—input accurate FICO scores (pulled free weekly), shop three quotes per category, and watch APRs converge 0.8% below initials.
Conclusion: Empowering Smarter Financing Choices
Rate calculators transform opaque APRs into actionable insights for home, highway, and everyday card spending, consistently showing how fees and terms dictate true costs across these pillars of personal finance; as April 2026 rates stabilize post-Fed tweaks, borrowers leveraging these tools report 15-20% savings on total interest, per aggregated fintech analytics. Experts agree the real power lies in iteration—tweak inputs, compare apples-to-apples, and align financing with budgets—turning what could be a maze of numbers into a roadmap for wealth-building. Those who master this decode not just rates, but their financial futures.